kSA RateRat Pro is a compact, convenient and easy-to-use optical metrology tool for thin-film characterization. Its unique capability is to measure, in situ and in real-time, optical constants (n and k), deposition rate and film thickness.

kSA RateRat is a compact and easy-to-use optical metrology tool for real-time thin-film process control and measurement of semitransparent films. It uses a proprietary algorithm which continuously updates the optical constants of the film derived from a least-squares fit to the optical reflectivity curve. kSA RateRat determines deposition rate, layer thickness, and optical constants (n and k) with as little as 600 Å of material deposited. kSA RateRat has many options to suit the needs of different applications and materials, including different laser/LED wavelengths (405, 532, 658, 950, and 1050 nm), as well as software integration capabilities. kSA RateRat is compatible with essentially any type of deposition method, including MBE, MOCVD, sputtering, and PLD. Research labs, processing facilities and industrial production where dielectric and semiconductor films and coatings need to be deposited with high precision all benefit from this tool.
 Click to Enlarge
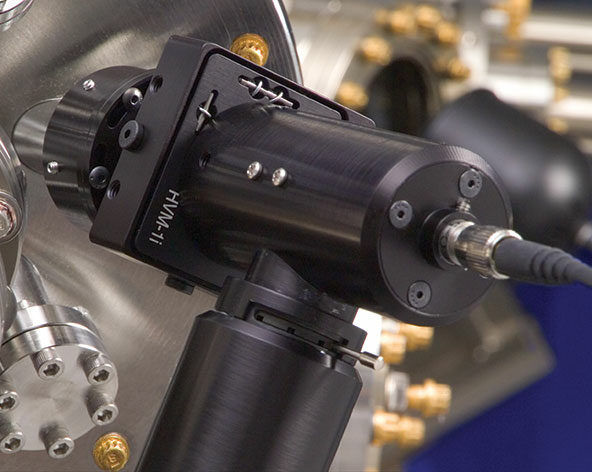
Compatibilities
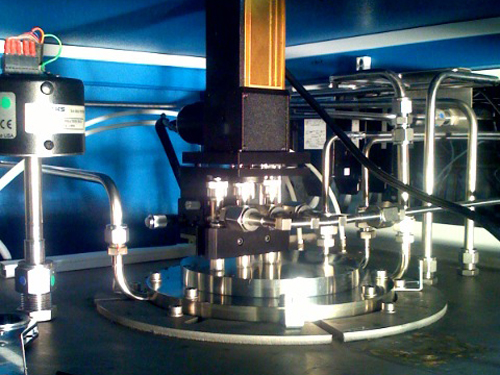
The kSA RateRat Pro thin-film growth rate monitor is compatible with essentially any type of thin-film deposition method, including MBE, MOCVD, sputtering, PLD, etc. It uses a laser diode source in specular geometry (usually normal incidence) and all of its components are outside the vacuum chamber, as a bolt-on accessory which can easily be added to an existing viewport.
 Click to Enlarge
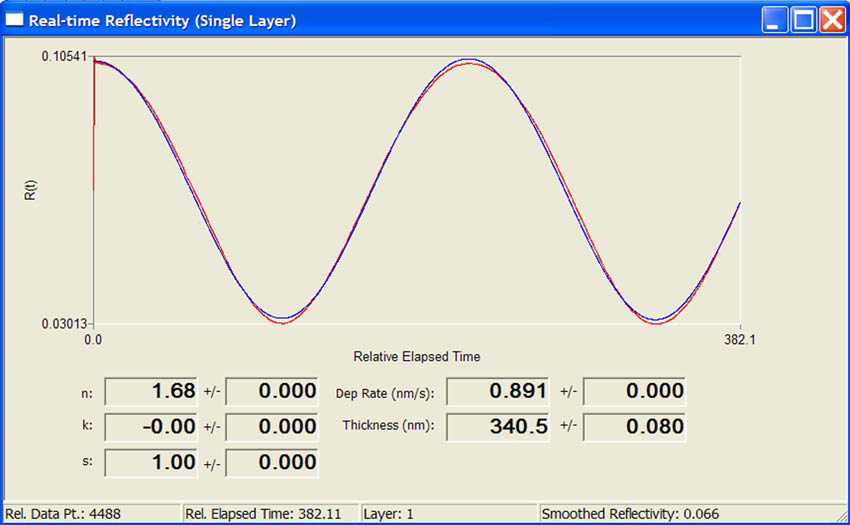
Real-Time Capability
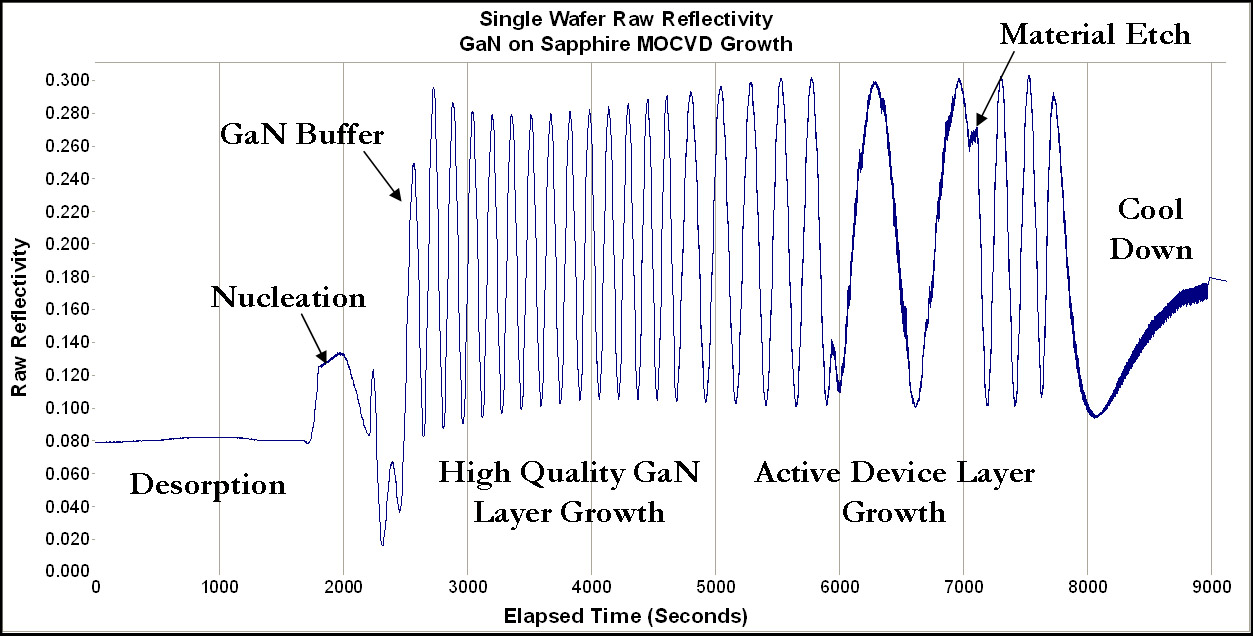
The real-time capability of kSA RateRat Pro is achieved by means of a proprietary algorithm which continuously updates the optical constants of the film, derived from a least-squares fit to the optical reflectivity curve. In this way the film-grower can have a continuous record of the progress of the film growth during its deposition, including all the critical parameters that are needed to characterize film quality and uniformity.
 Click to Enlarge
Options
kSA RateRat Pro has many options to suit the needs of different applications and materials, including different laser wavelengths (UV – Vis – IR) as well as full software integration with all the major process control platforms. Whether your needs are in precision optical coatings, solar cell manufacturing, LED production, organic semiconductors, or many other applications where accurate in situ, real-time, film monitoring is essential, kSA RateRat Pro has you covered.
For other thin film deposition monitor options, visit our thin-film thickness and deposition rate page.
References
In Situ Reflectance and Virtual Interface Analysis for Compound Semiconductor Process Control
William G. Breiland, Hong Q. Hou, Burrel E. Hammons, and John F. Klem, Sandia National Laboratories
In Situ Pre-Growth Calibration Using Reflectance as a Control Strategy for MOCVD Fabrication of Device Structures
William G. Breiland, Hong Q. Hou, Herman C. Chui, and Burrel E. Hammons, Sandia National Laboratories